English
 Français
In BrainHQ, you can compare your overall performance as well as your performance on each exercise and each level with other users in your age group. You can also compare yourself with people of other ages. This will give you an understanding of where you are doing well, and where you might want to improve further.
Finding Your Percentiles
If you wish to compare your performance to others
- Go to our web BrainHQ dynamicbrain.brainhq.com
- Click on the "Progress" tab at the top of the screen
- Click on the "Percentile" tab
The page you land on is called the "percentile" page because the way you will compare your performance to others is through your percentile score. This is where your performance is ranked compared to others on a scale of 1 to 99.
Percentiles are age-adjusted by default so that you are being compared to other BrainHQ users who were born in the same year. If you have not provided your year of birth on your profile page, then a default age of 50 is used instead. To enter your age, select PROFILE in the dropdown menu under your name on the top right corner of the screen.
Note that this information is only available through BrainHQ on the web - the graphs are not yet available for BrainHQ on mobile devices.
Checking Your Performance
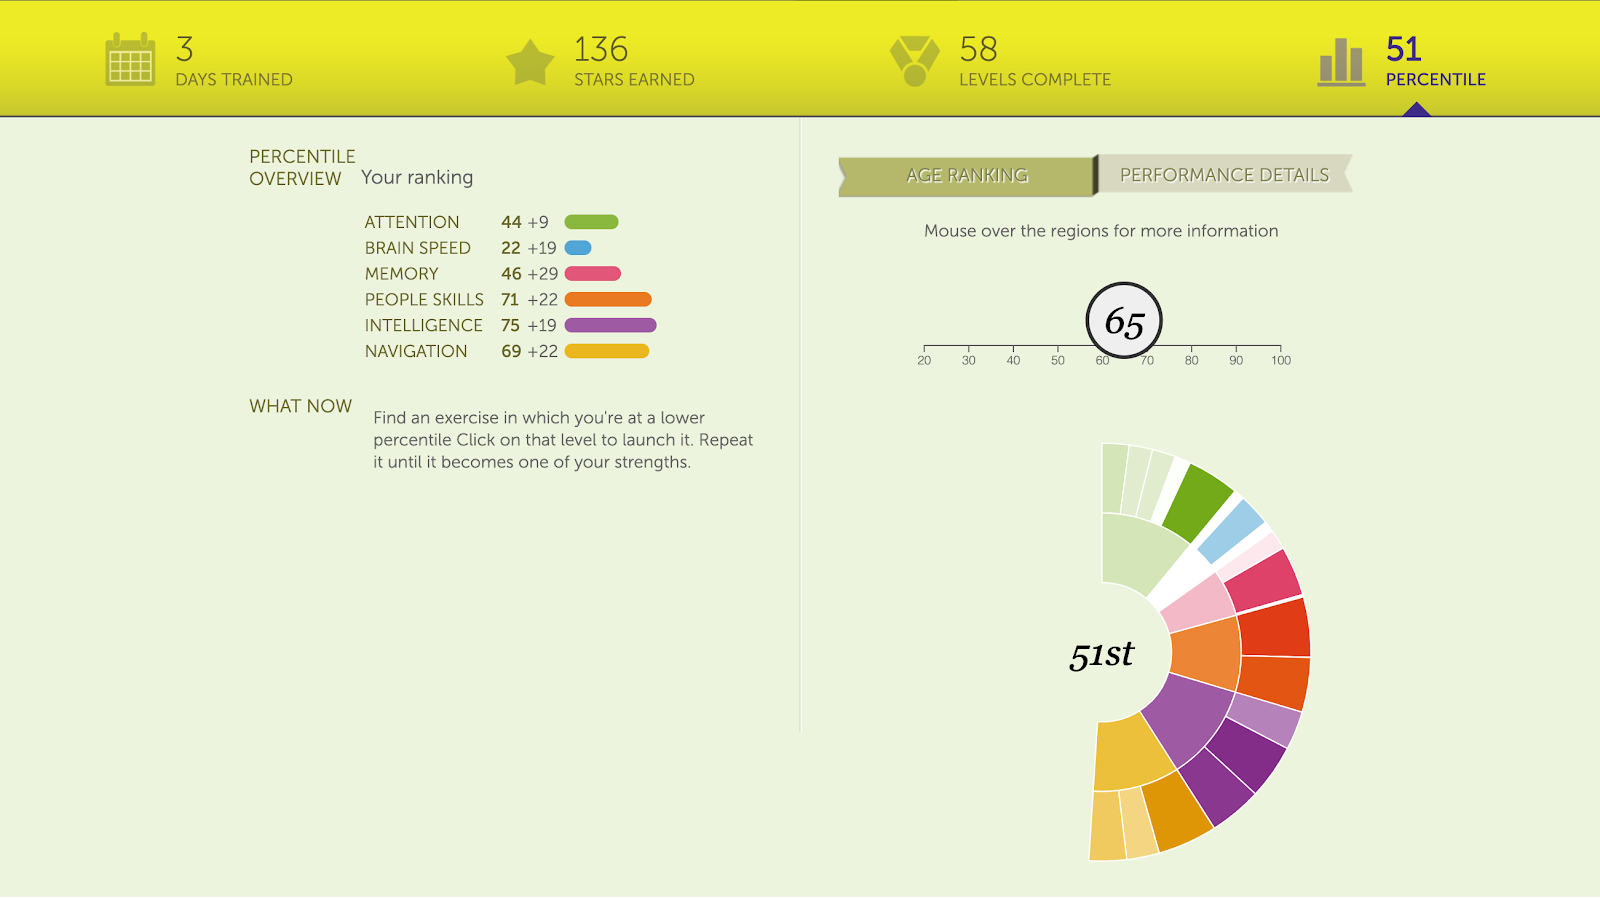
Under the Percentile tab you can see how your scores compare to other BrainHQ users. The number featured at the top of the page is your percentile compared to BrainHQ users that were born in the same year as you, the graph to the left shows your percentile breakdown by category, and the number in the middle of the Age Ranking is used to show how your percentile changes compared to other age groups.
Note that your percentile score can range from 1 to 99. The number indicates what percentage of BrainHQ users your score is higher than. Remember, these scores are not like letter grades in school. If your percentile score is 50, it doesn't mean you failed the test - it means you are scoring better than 50% of the people who have ever used BrainHQ!
Your Percentile Overview
On the left side of the screen you will see a graph that compares your performance in each exercise category - Attention, Brain Speed, Memory, People Skills, Intelligence, and Navigation - to all the other people using BrainHQ who have trained in those areas and categories.
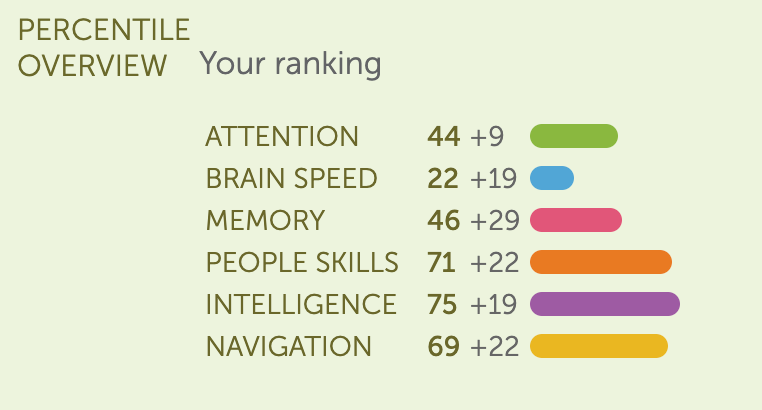
Your percentile score can range from 1 to 99, and is shown by both a number and a bar graph. The first number indicates what percentage of BrainHQ users in your age group that your score is higher than. In this example, the user's attention percentile score is 44, meaning that their performance is higher than 44% of BrainHQ users; their intelligence percentile score is 75, meaning that their performance is higher than 75% of BrainHQ users.
The number following the plus sign (+) shows your average improvement over your baseline scores in each category. The first time you complete an exercise you set a baseline score and BrainHQ then asks you to repeat that level to improve upon that score. When calculating the average improvement shown here, BrainHQ only includes levels that have been repeated. The percentile for the first performance is subtracted from the best performance percentile of all of the repeated levels and the average of these improvements across all the levels in the suite is shown as the suite improvement.
In the example above, the user is now scoring in the 71st percentile in People Skills exercises, and they've improved their scores by 22 percentile points on average since they began their training.
Age Ranking
On the right side of the page, you'll see a colorful circle underneath the banner "AGE RANKING". Here you can compare yourself to people of other ages. Want to see how you stack up to people in their 80's? Or in their twenties? Move the slider to the appropriate comparison.
Remeber, if you have not provided your year of birth on your profile page then a default age of 50 is used instead.
Additionally if you hover over the different sections of the wheel, you can see your average percentile per category (inner circle) or your average score for individual exercises (outer circle).
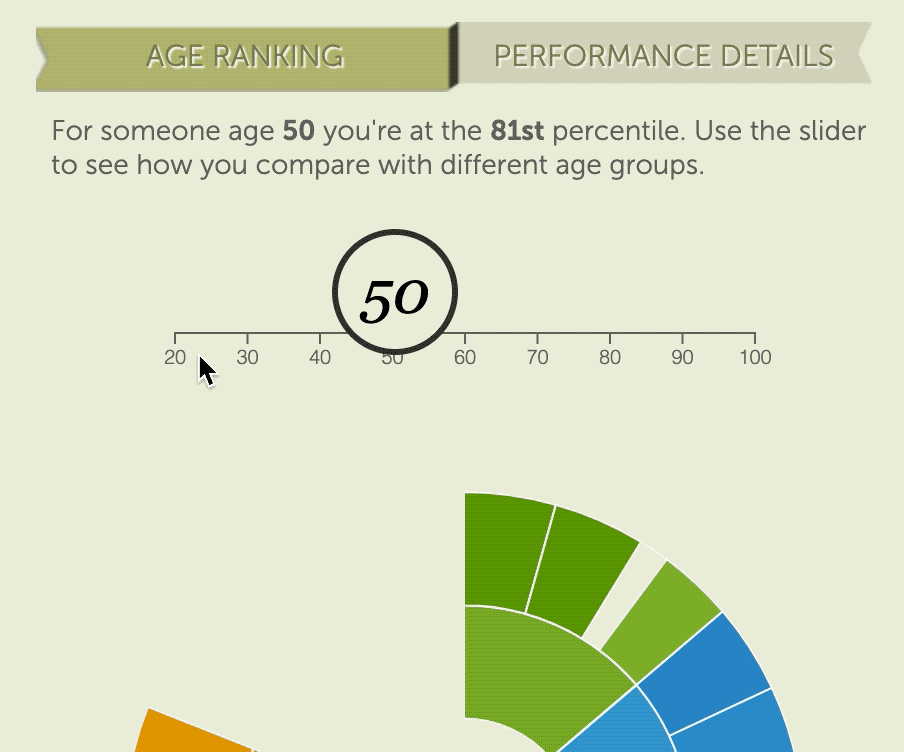
You can launch an exercise from the color wheel - just click on an exercise you'd like to improve on, and you'll be taken straight to training on the first level in that exercise that you haven't done yet.
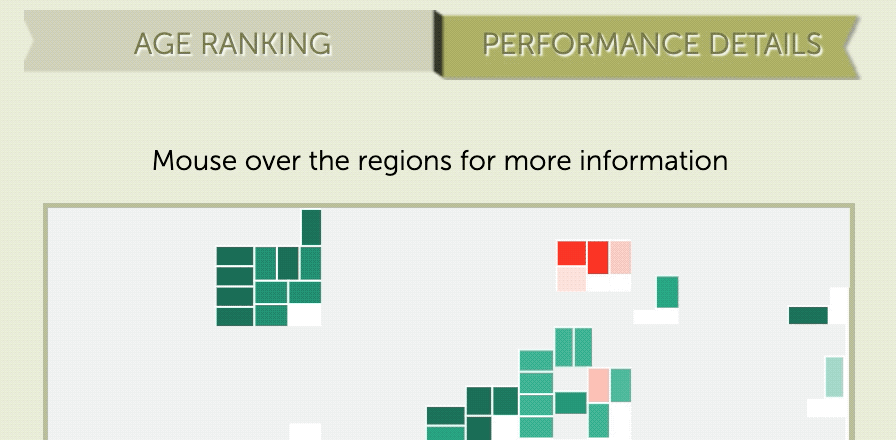
Your Performance Details
You can also check your performance compared to others on individual levels. On the top banner to the right of AGE RANKING, you will see "PERFORMANCE DETAILS", click on it.
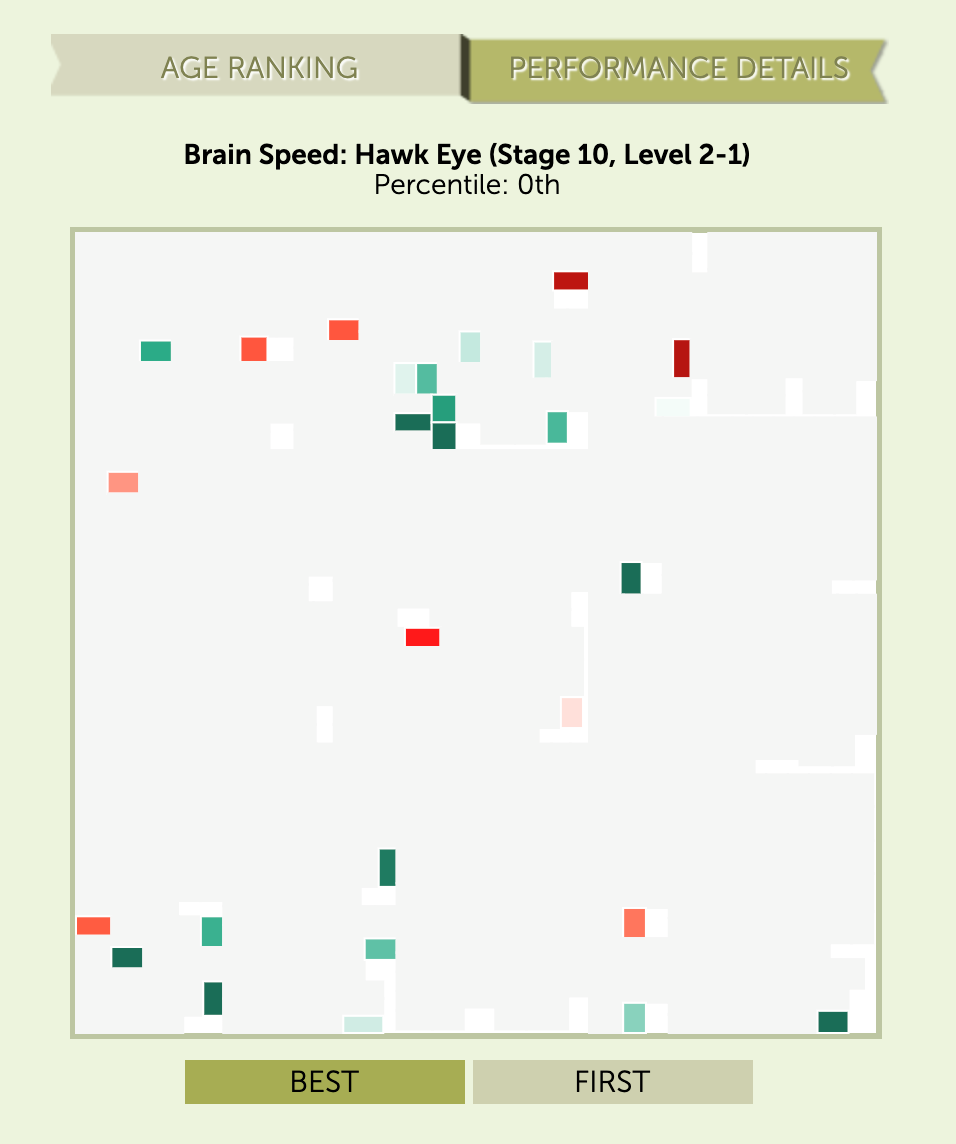
Each level is shown as a small rectangle, organized into groups by exercise. You can mouseover a rectangle, and the text above the image will show the exercise name and level. Red rectangles represent levels with relatively low performance, and green rectangles represent levels with relatively high performance. You can launch an exercise by clicking on a level you'd like to improve on, and you'll be taken straight to training on that level.
Below the Performance Details chart, there are two options: Best and First.

Your Performance Details chart will default to showing you your best scores, but if you want to see where you started you can click on "first". This will show you your baseline scores for each of the levels you've completed. Click back and forth between "best" and "first" to see these differences. You might find that several of the levels that were green on your "best" page started out as red on your "first" page. This is a great way to see how you've improved over multiple iterations of an exercise.
How BrainHQ Calculates Percentiles
Over time, many, many people have trained with BrainHQ. As a result, for each level in each exercise, BrainHQ has data that shows what typical performance is, what great performance is, and what not-so-good performance is.
Based on that data as you do a level, BrainHQ knows how your performance on each trial compares to that large population of people who have trained on the level before you. BrainHQ summarizes your best performance during the level in stars, showing you that you earned 1, 2, 3, 4 or 5 stars when you complete a level.
BrainHQ also keeps track of your performance at a more precise level - for example, that your average performance across all trials in the level is better than 17% of people (for example), or better than 81% of people (as another example). BrainHQ makes this calculation for you compared to everyone who has ever trained, and also for you compared to people around your age (you can set your age in your profile to ensure this comparison is accurate).
This allows BrainHQ to calculate an overall percentile score for you for each exercise, by averaging your best percentile score in each level you have done in an exercise. For example, in the Visual Sweeps exercise, you might have done the first two levels, and your best performance on the first level might be better than 85% of people in your age group and your best performance on the second level might be better than 65% of people in your age group. In this example, your percentile score for the Visual Sweeps would be 75% (the average of 85 and 65).
If you trained more on the second level, and improved your performance to be better than 95% of people in your age group, then your percentile score for the Visual Sweeps exercise would become 90% (the average of 85 and 95).
Your percentile scores for a suite are calculated by averaging together your percentile scores from all the levels in all the exercises in that suite. For example, if you've done two levels in Visual Sweeps and have a percentile score of 60% in that exercise, and you've done two levels of Auditory Sweeps and have a percentile score of 80% in that exercise, you will have an overall Brain Speed percentile score of 70%.
Your percentile scores are based on your best performance - if you had a great day, your percentile for the levels you did that day are based on that day. If you had a bad day later, your percentile scores do not decline. It's nice to see your percentile scores increase as your train! But they aren't the best way to track your performance over time - for that, take a look at your BrainAQ or track your progress on individual exercises.
Your percentile score can move around a lot as you do your first few days of training. For example, if you've only done four levels, the score that you get on your fifth level can change your overall percentile a lot. That doesn't mean your brain changed a lot! It just means that BrainHQ is getting a better estimate of your true performance.
Your percentile score might also decrease sometimes. For example, if you have an 80% percentile score in Attention, and you do a new level in an Attention Exercise like Target Tracker, you might score lower than the 80% percentile in the new level. You'll see your overall Attention score go down a little bit in this case. It doesn't mean your attention got worse! It just means that you should work on that new level to bring your performance up to your scores on the other levels. Also, your percentile score on each level is calculated by comparing your performance to the people who have done that level. As you start to train on the higher stages of the exercises in BrainHQ, you are being compared to people with very high performance - like you, they've advanced to these higher stages. This can have the effect of lowering your percentile score - not because your brain performance is lower, but just because you are being compared to a more and more elite group of brain trainers!