English
 Français
As you’re investing valuable time in training your brain, you want to know how you’re progressing, and how to interpret those results.
 Your ‘Stars’ Collection
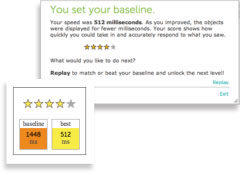
With every completed exercise level, you’ll see how many stars you’ve earned. The number of stars earned, reflect your percentile for that exercise at that specific level. Earning one star would indicate that you are in the lower percentile compared to all others who have done that exercise in the past. Earning five stars places you in an elite league, among the very best!
Your ‘Baseline’ and ‘Best’ Scores
Next to the star ranking, you’ll see your “baseline” and “best” scores for each exercise level. Baseline scores show the results from when you first completed the exercise, whereas the “best” shows your best score. Your results, in many cases, are measured in milliseconds (ms), and the lower it is, the better you have performed.
Your Personal Training Calendar
Tracking the details of your training activities, such as how much and when, is easy. Simply visit your profile page and look for your personal training calendar.
 Your Performance Chart and Progress
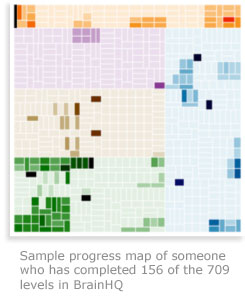
Check the Progress and Performance Chart to find detailed information on what exercise levels you have used, where you have excelled, where more training is required and so much more. A map is displayed showing every BrainHQ exercise and level completed. Every level trained is color-coded; the darker the shade the more times you have exercised at that level. You are also able to toggle to see your percentile and the number of stars earned for each exercise level. Each square on the map links you to a BrainHQ exercise level. This allows you to easily jump to new levels or return to the ones where you would like to improve your scores.
 Your Comparison Chart
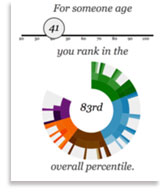
Learning how you measure and compare for those in your age bracket can be found on the comparison chart. This reflects your overall percentile performance versus others who have provided their age to BrainHQ. By scrolling over the individual parts of the comparison chart, you can see the specific details for each exercise and level while easily linking back to those areas where more work is needed. In reviewing the combined data for both your progress and performance, you’ll have a good understanding of how your brain is excelling using BrainHQ!