English
 Français
The Performance tab allows administrators to view the percentiles of all of their group members at a glance. This information is shown as an overall percentile score, and there’s also a breakdown showing percentile score by category, and the percentage of improvement.
Percentiles are based off of a sample of BrainHQ users that is updated regularly, not all BrainHQ users. Additionally, these percentiles are not age-adjusted, so their scores may differ when compared to a users personal progress page.
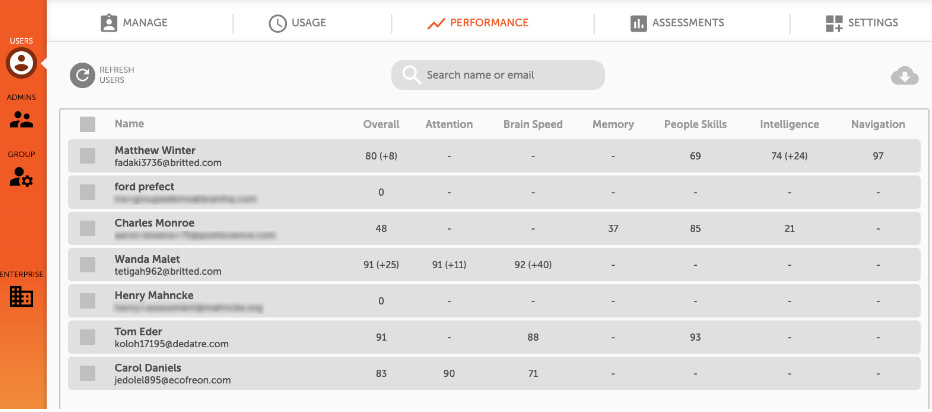
The Overall percentile score is an average of all category scores. The categories within BrainHQ are Attention, Brain Speed, Memory, Intelligence, and Navigation.
![]() The first number is the average percentile across exercises from a specific category. Next to some scores is a number in parentheses with a plus sign. The parenthetical number is the average percent improvement of the best percentile compared to the baseline percentile.
The first number is the average percentile across exercises from a specific category. Next to some scores is a number in parentheses with a plus sign. The parenthetical number is the average percent improvement of the best percentile compared to the baseline percentile.
![]() Download Report To download a performance report, click the checkbox next to the user’s name in the list of users. Select any number of accounts. The download button will turn from light gray to dark gray once a valid selection has been made, and clicking it will prompt a download of the report.
Download Report To download a performance report, click the checkbox next to the user’s name in the list of users. Select any number of accounts. The download button will turn from light gray to dark gray once a valid selection has been made, and clicking it will prompt a download of the report.
The Performance Report will show overall percentile, overall improvement, and total number of levels completed. This is further broken down by category. For example, Attention Percentile, Attention Percentile Improvement, and Attention Number of Levels.