English
 Français
The Usage tab allows administrators to quickly view when their group members last trained, how many total levels of BrainHQ they’ve completed, see their overall training trends, view their progress towards their weekly goal, and check what days they trained throughout the week.
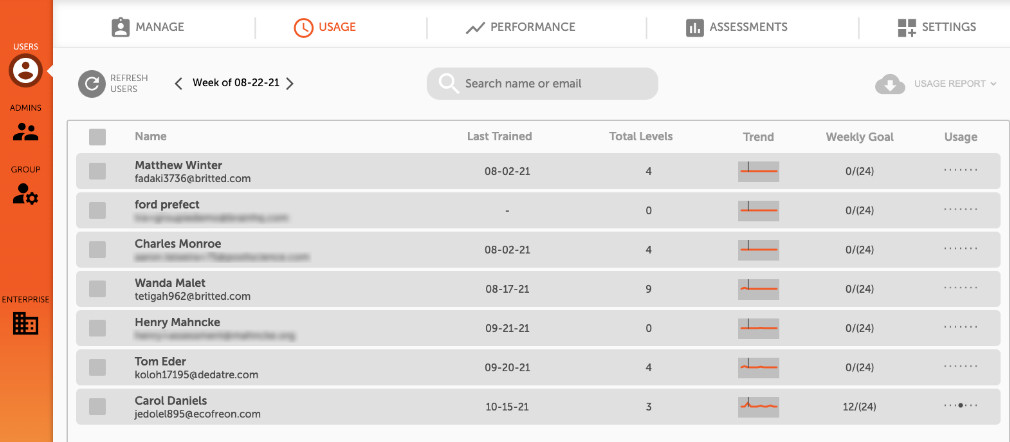
![]() Refresh Users Click this button to update the user list once any changes are made. This button is available on all sub-menu tabs.
Refresh Users Click this button to update the user list once any changes are made. This button is available on all sub-menu tabs.
![]() Weekly View Use the left and right arrows to change which week to view.
Weekly View Use the left and right arrows to change which week to view.
A marker will appear on the Trend line to show the corresponding account activity, their work towards their Weekly Goal, and the Usage dots will indicate what days of the week they had done their training.

![]() Download Reports To download a usage report, click the checkbox next to the user’s name in the list of users. Select any number of accounts. The download button will turn from light gray to dark gray once a valid selection has been made. From here, click the down arrow to select what kind of report to download.
Download Reports To download a usage report, click the checkbox next to the user’s name in the list of users. Select any number of accounts. The download button will turn from light gray to dark gray once a valid selection has been made. From here, click the down arrow to select what kind of report to download.
The Usage Report shows how many total levels the users have completed, and will show how many levels each week were completed.
Accessing the Levels Report is a two-step process. The first csv file contains a link which can be opened in a web browser. This link will only work for 24 hours after generation. Once the link has been submitted the levels report will begin downloading.
The Levels Report is comprehensive; it will show all levels that have been completed for the selected users and specific information for the levels completed.
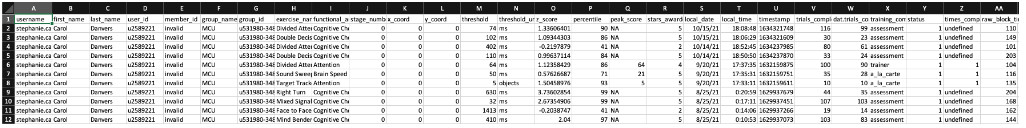
Below is a description of each header in the CSV file:
- username: The email address of the user
- first_name, last_name: The first and last name of the user
- user_id: The BrainHQ user ID (uID) number
- member_id: The user’s membership number provided by certain partners; in most cases this will be listed as “invalid”.
- group_name: The name of the group that the member belongs to
- group_id: The BrainHQ group ID (gID) number
- exercise_name: The name of the exercise
- functional_area: This will either be the category that the BrainHQ exercise belongs to, or it will be the name of the assessment that the exercise was used in
- stage_number: A numbering system starting at 0 for each stage of an exercise. For example, Sound Sweeps has a total of 5 stages. The grid number will be 0 in the CSV to reflect Stage 1, 1 for Stage 2, 2 for Stage 3, 3 for Stage 4, and 4 for Stage 5.
- x_coord: X-Coordinate position on the Stage (grid) which starts at 0 and increases left to right across columns of the grid. Example: Sound Sweeps has 9 levels (3 rows x 3 columns) on Stage 2 so the possible x coordinates at that Stage are 0, 1, and 2 because there are only 3 columns.
- y_coord: Y-Coordinate position on Stage (grid) which starts at 0 and increases top to bottom across rows of the grid.
- *Important* The combination of [grid_number, x_coord, and y_coord] define the specific level of the exercise played. Example: for Stage 2 of Sound Sweeps, the combination of [1,0,0] is the left-most level on the top row and [1,2,2] is the right-most level on the bottom-row.
- *Important* Exercises used in assessments will always have 0’s in these three columns.
- threshold: Threshold in raw units. This is a dependent variable. Note that different levels of an exercise introduce new parameters. For this reason, thresholds should not be compared between different levels as a measure of training improvement. Thresholds should only be compared within the same level.
- threshold_units: The units of the threshold score. For example, “objects” is the number of objects, “ms” is milliseconds, etc.
- z_score: The raw threshold score is converted into a z-score using baseline means and standard deviations from the users in the BrainHQ database who played that level of the exercise (i.e., the user’s score on the level minus the mean of baseline scores for that level / SD of the baseline scores for that level).
- percentile: Percentiles represent how much better a user performed relative to other users in the BrainHQ database. For example, a percentile of 95 means the user scored better than 95% of people in BrainHQ doing the same tasks. Higher percentiles are always better than lower percentiles. Average is a percentile of 50.
- peak_score: The highest score that the user achieved while working on a level. For example: if the user trained with 10 trials of Target Tracker and were able to get to 7 objects on trial 5 but ended the exercise with 4 objects, then their threshold would be 4 but their peak_score would be 7.
- stars_awarded: This gives a measure of performance for each level compared to our database of BrainHQ users. The stars are awarded based on standard deviations from the mean baseline performance for all users who have completed that level. Star calculations use peak scores rather than threshold scores.
- 0 stars: < -1.5 3 stars: ≥ 0.5
- 1 star: ≥ -1.5 4 stars: ≥ 1.0
- 2 stars: ≥ -0.5 5 stars: ≥ 1.5
- local_date: The date that the level was played.
- local_time: The time that the exercise was completed in the local user’s time zone.
- timestamp: Computer timestamp shows the number of seconds since 1/1/1970. There are online converters (http://www.epochconverter.com/) that can translate this number into a date and time. The timestamp marks the end of the block.
- trials_completed: The number of trials completed in the exercise.
- dat.trials_correct: The number of trials that were answered correctly in the exercise.
- training_context: This will either be how the user navigated to that exercise (trainer, a la carte, etc), or it will listed as part of an assessment
- status: A value of 0 means the level was not completed; a value of 1 means that the level was completed.
- times_completed: The number of completions up to the point the specific level was completed.
- raw_block_time: The time spent between when the start button for a level was pressed and when the level ended (in seconds). Watch for large numbers, which can happen if the user pauses and leaves the exercise or leaves exercises running unattended. We usually filter levels with large numbers from the analyses because they indicate that the user was distracted mid-block.